














The Pulse NewsletterExpert heart health, in plain English. Fortnightly, from our clinicians.Subscribe →
Section
Tests & Procedures
Being referred for a cardiac test can feel daunting, especially when you’re not sure what to expect. The Tests section explores the most common cardiac investigations — from ECGs and echocardiograms to stress tests and coronary angiograms. Each article explains what a test involves and what the results generally mean, written by cardiologists to help readers feel more informed going into their next appointment.
Understanding your condition is the single most important thing you can do after a heart diagnosis. Don't just read — ask questions, take notes, bring them to your cardiologist.
Prof. Peter Barlis · Founding Editor, Heart Matters
Being referred for a cardiac test can feel daunting, especially when you’re not sure what to expect. The Tests section explores the most common cardiac investigations — from ECGs and echocardiograms to stress tests and coronary angiograms. Each article explains what a test involves and what the results generally mean, written by cardiologists to help readers feel more informed going into their next appointment.
Most people are home within hours of a coronary angiogram, but knowing what to expect from the TR band, the results conversation, and the days after makes a real difference.
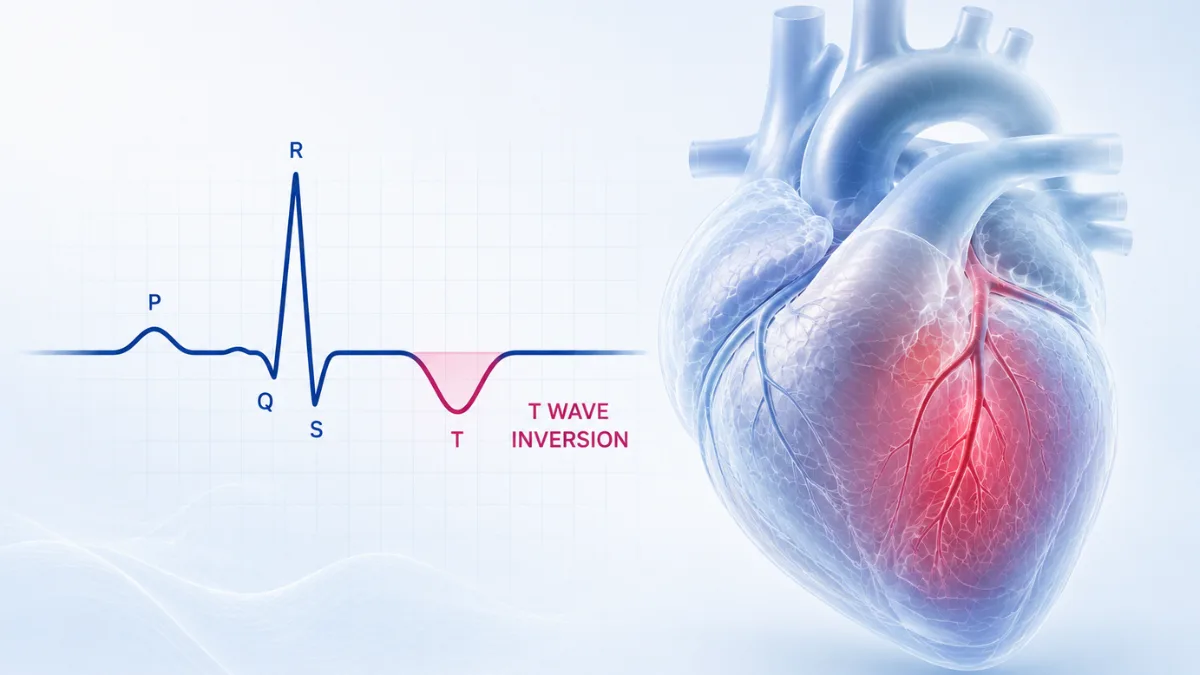
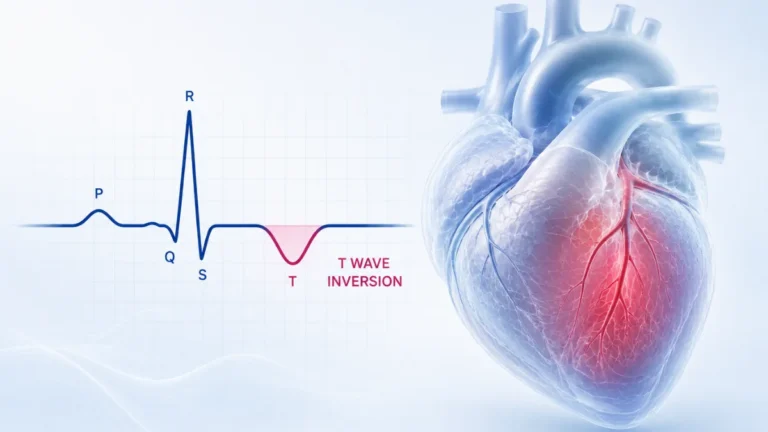
An ECG records the heart from twelve different viewpoints. After each beat the heart resets, and that recovery shows on the tracing as a rounded wave called the T wave.
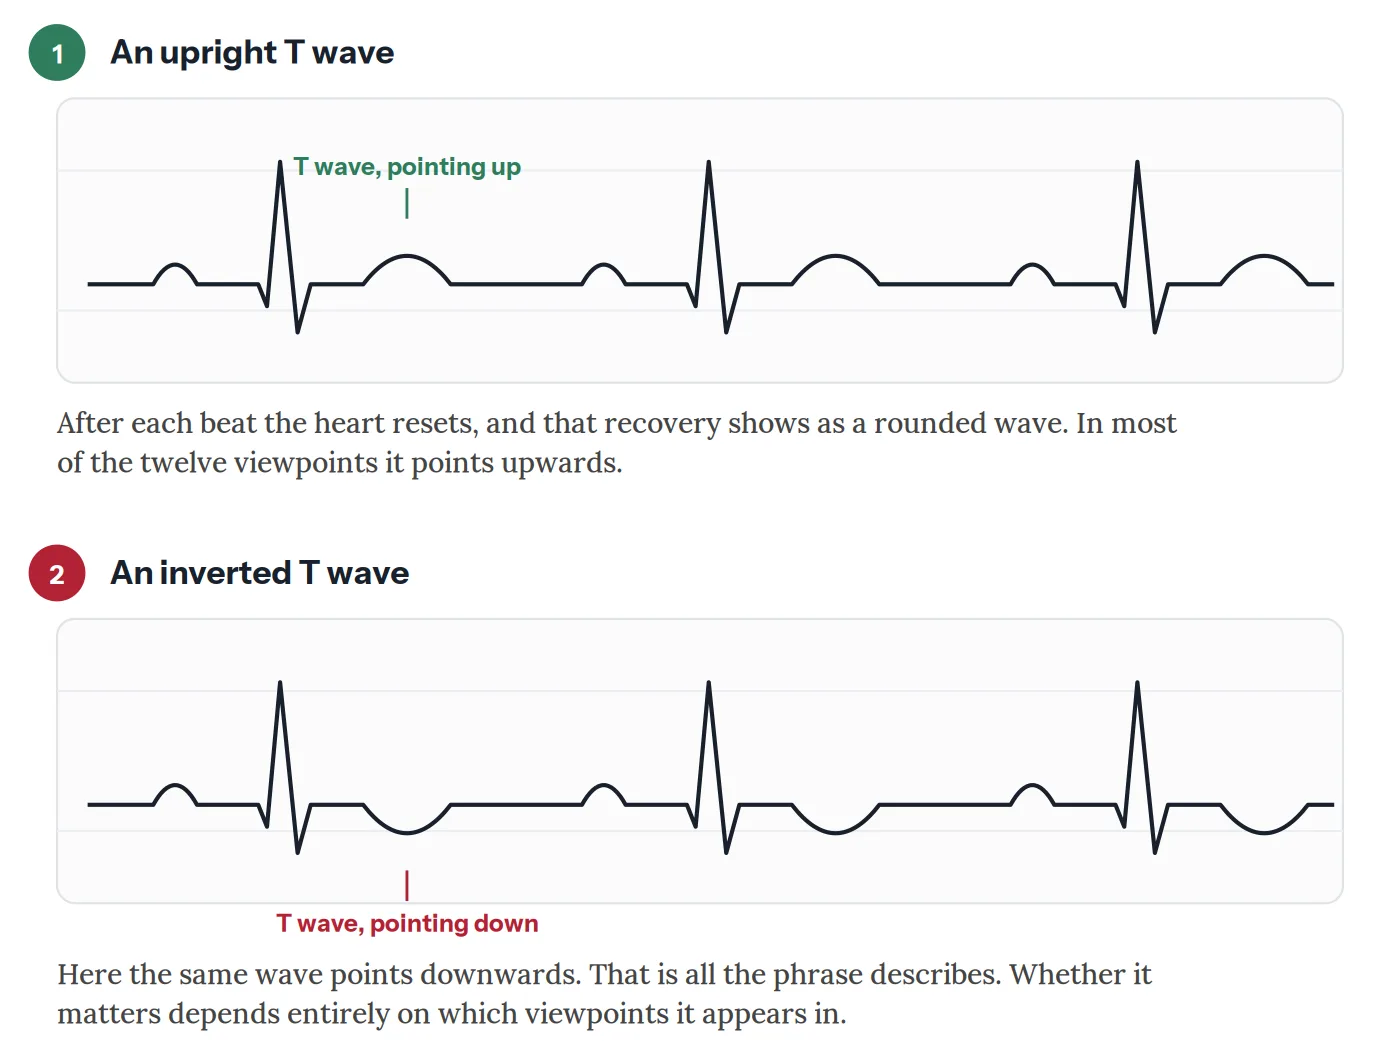
In most viewpoints that wave points upwards. When it points downwards instead, the report describes it as T wave inversion.
In several viewpoints a downward T wave is entirely normal and expected, so the phrase on its own says very little.
What determines whether it matters is which viewpoints are involved, whether it is new compared with a previous tracing, and whether there are any symptoms.
A previous ECG, if one exists, is often the single most useful piece of information, because a longstanding pattern and a new one carry very different weight.
Of all the phrases that turn up on an ECG report, T wave inversion is among the most common and the least self-explanatory. It sounds like something has been reversed, or has gone wrong in a way that ought to be obvious.
What it describes is narrower than that. A small wave on the tracing points downwards instead of upwards. In several of the heart’s twelve viewpoints that is completely normal. In others it can be important. The phrase alone does not tell you which situation you are in.
What the T Wave Is
Each heartbeat has two halves. The heart muscle activates and contracts, then it has to reset electrically before it can do it again.
On an ECG tracing, the tall spike is the contraction. The rounded wave that follows it is the reset. That second wave is the T wave.
The difference is simply which way the recovery wave points. Whether that matters depends on which of the heart’s twelve viewpoints it appears in, Heart Matters
Because the twelve viewpoints look at the heart from different angles, the same electrical recovery appears differently in each. In most of them the T wave points upwards. In a few it normally points down, and always has.
Where a Downward T Wave Is Simply Normal
This is the part that resolves most people’s concern, and it is worth stating plainly.
One viewpoint, the one labelled aVR, has a downward T wave in essentially everybody. It looks at the heart from the opposite direction to the others, so an upward wave there would be the abnormal finding.
Two others, V1 and lead III, very commonly show a downward T wave in healthy people. So does lead V2 in some. An automated report will still flag these, because software counts rather than interprets.
There is also a pattern sometimes called the persistent juvenile pattern. Children normally have downward T waves across several of the chest viewpoints, and in most people these turn upward through adolescence. In some adults, more often women and more often people of African or Caribbean ancestry, the childhood pattern simply persists. It is a normal variant, not a disease.
In some viewpoints a downward T wave is the expected finding. The software flags it anyway, because it counts rather than interprets.
What Determines Whether It Matters
Three questions decide almost everything, and a cardiologist works through them in this order.
Reassuring Usually needs nothing beyond an explanation
The inversion sits only in aVR, V1, or lead III, where it is normal.
An older tracing shows the same pattern, unchanged over years.
There are no symptoms, and the rest of the ECG is normal.
The person is young, fit, and the pattern fits a recognised normal variant.
Worth explaining Usually has a cause that is already known
The inversion accompanies a bundle branch block, where changed conduction alters the recovery wave as a matter of course.
It accompanies a thickened heart muscle, where the pattern is sometimes described as strain.
Certain medicines, including digoxin, change the shape of the recovery wave predictably.
Low potassium or magnesium can flatten or invert it, and correcting the level corrects the tracing.
Investigated promptly The pattern, the symptoms, or the change over time raises concern
The inversion is new compared with a previous tracing.
It appears across several neighbouring viewpoints rather than one.
It is deep and symmetrical rather than shallow, particularly across the front of the heart.
There are symptoms, especially chest discomfort, breathlessness, or fainting.
The Pattern Cardiologists Look For First
There is one specific arrangement worth knowing about, because it is the reason this finding is never dismissed out of hand.
Deep, symmetrical T wave inversion across the viewpoints that look at the front of the heart, appearing in someone who has recently had chest pain that has since settled, can indicate a critical narrowing in the artery supplying that territory. The person often feels fine at the moment the tracing is taken, which is exactly what makes it dangerous.
It is uncommon. Most T wave inversion is nothing like this. But it is the reason a cardiologist will ask carefully about recent chest pain even when someone currently feels well, and why this particular pattern prompts prompt assessment of the coronary arteries rather than watchful waiting.
Other Causes Worth Knowing
Beyond the coronary arteries, several conditions change the recovery wave.
A previous heart attack leaves permanent changes in the viewpoints that looked at the damaged area, often alongside Q waves.
Thickened heart muscle, whether from long-standing high blood pressure or from hypertrophic cardiomyopathy, alters recovery across several viewpoints. In the inherited condition the changes can be striking, and they are one of the findings that prompts further imaging in a young person.
Inflammation of the heart muscle or its surrounding sac produces widespread changes rather than ones confined to a single artery’s territory.
A clot in the lungs can invert the T waves across the right-sided viewpoints, usually alongside breathlessness and a fast heart rate.
Conditions affecting the brain, including bleeding around it, can produce dramatic deep T wave inversion. These are sometimes called cerebral T waves, and the heart itself is normal.
Athletic training changes the ECG in ways that overlap with disease, and distinguishing the two is a recognised specialty in its own right. Ancestry matters here: T wave inversion across the front chest viewpoints is a well-described normal finding in athletes of African or Caribbean ancestry, and considerably more concerning in others.
What Usually Happens Next
The single most useful step is finding an old ECG. A pattern that has been present for a decade means something entirely different from one that appeared last month, and comparison answers the question faster than any new test.
If there is no previous tracing, or the pattern is new, the usual next steps depend on the picture. A troponin blood test checks whether heart muscle has been damaged. An echocardiogram looks at the muscle thickness and how well each area is moving, which can show a problem in the same territory the ECG pointed at.
Where the coronary arteries are the concern, a stress test or a CT coronary angiogram follows. Where the finding is unexplained in a young person, cardiac MRI is often used, because it shows the muscle in more detail than ultrasound can.
And in a great many cases none of this is needed, because the inversion sits in a viewpoint where it belongs and the conversation ends there.
Conclusion
T wave inversion describes the direction of a small wave on a tracing. That is genuinely all the phrase means, and in several viewpoints the downward direction is the normal one.
What turns it into something worth investigating is context: which viewpoints, whether it is new, and whether anything else is going on. Those are questions a person cannot answer from the report alone, and they are the right things to ask.
If you have been given this finding, two pieces of information will shape the conversation more than anything else. Whether an older ECG exists for comparison, and whether you have had any symptoms, particularly chest discomfort, in the weeks beforehand. Both are worth mentioning without being asked.
“Left ventricular hypertrophy” on an ECG report means the tracing showed larger than usual electrical voltages, which can happen when the heart’s main pumping chamber has thickened. It is a suggestion, not a diagnosis.
The ECG measures electrical voltage rather than muscle thickness. It picks up a great deal well, but wall thickness is inferred rather than measured, so a normal ECG does not rule thickening out.
Body build affects the reading. Where there is less tissue between the heart and the electrodes, the voltages run higher with no thickening at all.
An echocardiogram settles the question, because it measures the muscle directly rather than inferring it from voltage.
Where genuine thickening is confirmed, the cause matters more than the finding. High blood pressure is by far the most common, and the thickening can partly reverse when the pressure is treated.
Among the phrases that automated ECG software generates, “left ventricular hypertrophy” is one of the more alarming to read. It sounds like a diagnosis of something structural and permanent. Hypertrophy means enlargement. Left ventricular means the main pumping chamber. Put together, it reads as though a machine has just told you your heart is abnormally big.
What the machine has actually done is add up some voltages and compare the total against a threshold. Whether that reflects anything real about your heart is a separate question, and one the ECG is not well equipped to answer.
What the Left Ventricle Does and Why It Thickens
The left ventricle is the chamber that pushes blood out to the entire body. It is the thickest-walled part of the heart because it does the most work.
Like any muscle, it responds to sustained extra load by getting thicker. If it has to push against higher pressure with every single beat, year after year, the wall builds up in response. That is left ventricular hypertrophy.
It is not a disease in itself. It is an adaptation, and the important question is always what it is adapting to.
What the ECG Can and Cannot Tell You
The ECG is a genuinely valuable test, and it is ordered as often as it is for good reason. It detects rhythm disturbances, conduction problems, and the changes of a heart attack quickly, cheaply and reliably. For those questions it is hard to better.
Wall thickness is simply not one of the things it measures directly. It measures electrical voltage at the skin. The reasoning behind the criteria is that a thicker muscle generates a larger electrical signal, so an unusually large signal might indicate a thicker wall.
That reasoning is sound, but voltage is an indirect measure. Depending on which criteria are used and which population is studied, the ECG identifies somewhere between roughly a fifth and a half of people who genuinely have a thickened left ventricle on imaging. It is a screening signal rather than a measurement.
The reason is that voltage at the skin depends on a great deal besides the heart. Chest wall thickness, body size, lung volume, the position of the heart in the chest, and even the exact placement of the electrodes all influence the reading.
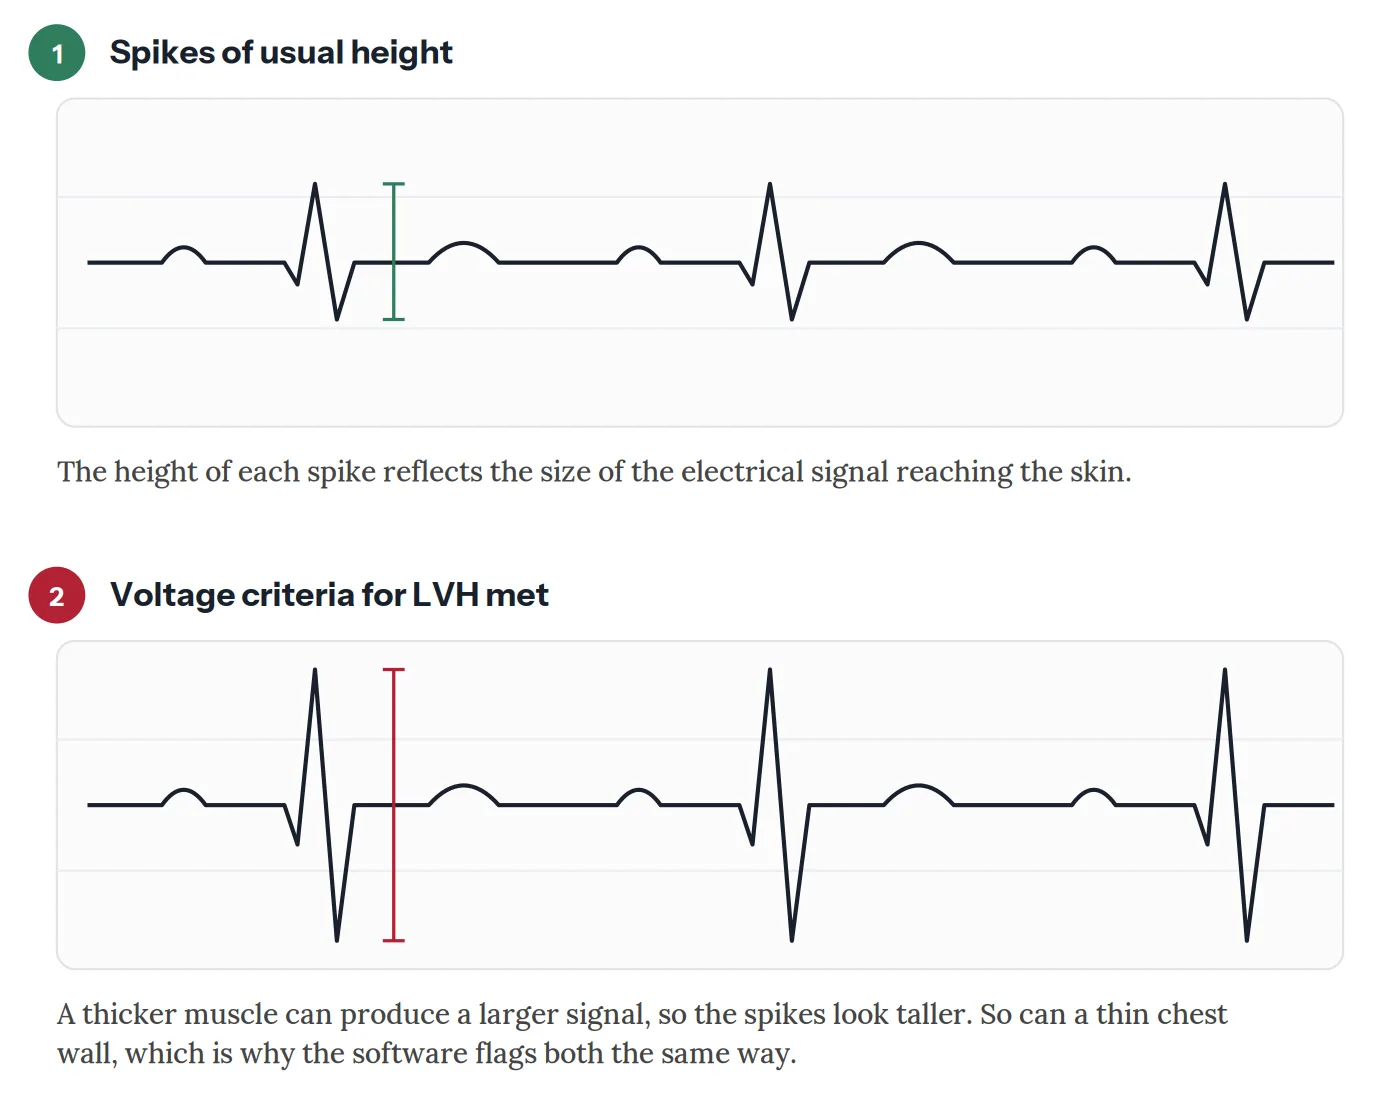
A thicker muscle and a thinner chest wall both raise the voltage, which is why the ECG raises the question rather than answering it.
This is why the finding turns up so often in people whose hearts are entirely normal. Where there is less tissue between the heart and the electrodes, the signal arrives stronger and the voltages read higher. Regular endurance training adds to this, partly for the same reason and partly because it produces some genuine and entirely healthy adaptation of the muscle.
The reverse happens too. Someone carrying extra weight, or with lung disease, may have a genuinely thickened ventricle and a completely unremarkable ECG, because the signal is dampened before it reaches the skin. This is why a normal tracing does not settle the question either.
A thicker muscle can produce a larger signal, so the spikes look taller. A thin chest wall can do the same, which is why the finding prompts a closer look rather than settling the question, Heart Matters
What the Report Might Say
The wording varies between machines, and the differences carry meaning.
“Voltage criteria for LVH” is the mildest version. It means only that the numbers exceeded a threshold. In someone with no symptoms and nothing else on the tracing, this on its own very often means nothing.
“LVH with repolarisation abnormality”, sometimes written as a strain pattern, is a more meaningful finding. Here the tracing shows not just large voltages but changes in how the heart muscle recovers between beats. That combination is more likely to reflect genuine thickening and is more strongly linked to cardiovascular risk over time.
“Left atrial enlargement” appearing alongside it adds weight too, because the upper chamber often enlarges in response to a stiff, thickened ventricle below it.
What Causes Genuine Thickening
High blood pressure is by far the most common cause and the reason the finding matters. Every beat against elevated pressure asks more of the muscle, and the wall thickens accordingly. This is often the first hint that blood pressure has been higher than realised for longer than realised.
Aortic stenosis, where the valve at the exit of the left ventricle narrows, creates the same problem more acutely. The chamber has to force blood through a restricted opening, and thickens in response. Aortic stenosis is usually audible as a murmur, so it rarely comes as a surprise on an ECG alone.
Athletic training produces genuine adaptation in endurance and strength athletes, and it is generally benign and reversible with detraining. Distinguishing it from the conditions below is one of the more nuanced judgements in cardiology.
Hypertrophic cardiomyopathy is an inherited condition in which the muscle thickens without any load driving it. It is much less common than the causes above, but it matters because it can affect young people and runs in families. HCM is one reason an unexplained finding in a young person is worth following up rather than dismissing.
Infiltrative conditions such as cardiac amyloidosis can thicken the wall with deposited protein rather than muscle. A distinctive combination sometimes appears here: a wall that looks thick on imaging alongside unexpectedly small voltages on the ECG.
What Happens Next
The finding is usually followed by an echocardiogram, an ultrasound that measures the wall thickness directly and calculates the muscle mass. It answers in twenty minutes what the ECG could only infer, and it also shows whether the chamber is pumping and filling normally.
Watch: what an echocardiogram involves, what it measures, and why it answers questions the ECG can only raise, Heart Matters Educational Series
Blood pressure assessment usually follows too, and often means readings taken at home or over 24 hours rather than a single clinic measurement, since a one-off reading is a poor guide to the pressure the heart has actually been working against.
Where thickening is confirmed and the cause is not obvious, further tests may follow depending on the pattern seen, which might include cardiac MRI, blood tests, or a family history and genetic assessment if an inherited condition is suspected.
Why It Is Worth Knowing About
Confirmed left ventricular hypertrophy is not something to panic about, but it is not nothing either. It is associated over the long term with a higher likelihood of atrial fibrillation, of heart failure, and of stroke, which is why cardiologists take it seriously as a marker even when the person feels entirely well.
The encouraging part is that it is not necessarily permanent. Where high blood pressure is the cause, sustained treatment can produce measurable regression of the thickening over months to years. The muscle that built up in response to pressure can partly unbuild when the pressure comes down. Studies have found that people whose ECG signs of hypertrophy regress with treatment go on to have fewer cardiovascular events than those whose do not.
That makes this one of the more actionable findings on an ECG report. It points at something that can be changed.
Conclusion
“Left ventricular hypertrophy” on an automated ECG report is a prompt to look further, not a verdict. In someone with no symptoms and an otherwise normal tracing it very often reflects nothing more than how the signal reaches the skin. In someone with high blood pressure it may be the first visible sign of what that pressure has been doing quietly for years.
Either way, the next step is the test that measures the muscle directly. An echocardiogram does that, and it is straightforward. What matters most is the conversation about what might be driving it, because for the most common cause, treatment does not just stop the thickening progressing. It can reverse some of it.
A stress echocardiogram combines an ultrasound of the heart with an exercise challenge, revealing how the heart performs under pressure, not just at rest.
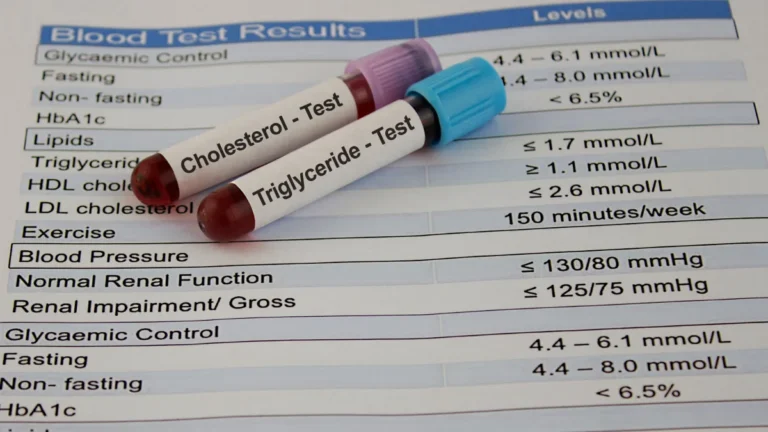
ApoB is a single protein that sits on the surface of every cholesterol particle capable of causing plaque, so an apoB result is effectively a headcount of all the particles that can harm your arteries.
A standard LDL cholesterol result measures the cholesterol carried inside your particles, not how many particles there are. Most of the time the two agree, but in some people they do not.
When LDL cholesterol looks reassuring but apoB is high, this mismatch (called discordance) can reveal hidden risk that a routine cholesterol panel misses.
Strong evidence supports apoB as an accurate marker of cardiovascular risk, particularly in people with high triglycerides, type 2 diabetes, or metabolic syndrome.
ApoB does not replace your LDL, triglycerides, or lipoprotein(a) results. Each tells you something the others cannot, and the best assessment uses them together.
No single number captures your risk. Heart disease is multifactorial, so blood pressure, diabetes, smoking, weight, and family history all matter alongside your lipids. Investigations such as a calcium score add another layer, and whether to add apoB is a conversation worth having with your cardiologist.
There is a lively and sometimes heated debate online about cholesterol. One vocal group argues that the LDL cholesterol number most of us have measured for decades is almost beside the point, and that a different number, apolipoprotein B, or apoB, is the one that truly predicts heart disease. If you have come across this argument and felt unsure who to believe, you are not alone.
The truth, as is so often the case in medicine, sits between the two extremes. ApoB is a genuinely valuable measurement, and the science behind it is sound. It is also not a magic number that makes everything else obsolete. This article explains what apoB actually is, why it can outperform a standard cholesterol result, and how to think about whether it belongs in your own blood tests.
What Is ApoB, Exactly?
To understand apoB, it helps to picture how cholesterol travels through your blood. Cholesterol is a fatty substance, and fat does not dissolve in water. So your body packages cholesterol inside tiny spherical particles that can move through the bloodstream. The particles that drive atherosclerosis, the gradual furring of the arteries, include LDL (low density lipoprotein) and a few close relatives.
Here is the key fact. Every one of these harmful particles carries exactly one molecule of a protein called apolipoprotein B on its surface. One particle, one apoB. This includes LDL, VLDL, IDL, and even lipoprotein(a). So when a laboratory measures your apoB level, it is effectively counting the total number of particles in your blood that are capable of lodging in your artery wall and forming plaque.
Why Counting Particles Can Beat Measuring Cholesterol
A standard lipid panel reports your LDL cholesterol, which sounds like it should tell you everything. But LDL cholesterol measures the amount of cholesterol carried inside your LDL particles. It does not measure how many particles you have.
This distinction matters because particles vary in size. Some people carry a smaller number of large, cholesterol-rich particles. Others carry a large number of small, cholesterol-poor particles. Two people can have an identical LDL cholesterol result while one has far more circulating particles than the other. Since it is the particles themselves that burrow into the artery wall, the person with more particles carries more risk, even though their cholesterol number looks the same.
A useful way to picture it: imagine traffic on a motorway. LDL cholesterol tells you the total weight of cargo being carried. ApoB tells you how many vehicles are on the road. If your arteries are the road, it is the number of vehicles, not the total cargo, that determines how often something collides with the wall.
One protein per particle
Every harmful cholesterol particle carries a single apoB protein, so your apoB level counts every particle that can cause plaque.
Cargo versus headcount
LDL cholesterol measures the cargo carried inside particles. ApoB counts the particles themselves, which is what damages the artery wall.
Why the gap matters
When particle count is high but cholesterol per particle is low, your LDL result can look fine while your true risk is not.
The family of particles apoB counts
ApoB does not just count LDL. It tags several related particles, each of which can contribute to plaque. This is part of why a single apoB result can be so informative: it captures the whole atherogenic family in one number.
LDL
Low density lipoprotein. The most familiar and most numerous of the harmful particles, and the main driver of plaque in most people.
VLDL and IDL
Larger, triglyceride-rich particles and their remnants. They become more important when triglycerides are high.
Lipoprotein(a)
An LDL-like particle with an extra protein attached. Largely inherited, and counted within apoB but not separately identified by it.
Each of these carries one apoB protein, so they are all captured in your total. What apoB cannot do is tell you the breakdown. It will not reveal, for instance, whether a high count is driven by ordinary LDL or by an inherited excess of Lp(a). That is one reason the individual tests retain their value, a point we return to below.
When LDL Cholesterol and ApoB Disagree
Most of the time, your LDL cholesterol and your apoB tell the same story. When both are high, or both are low, doctors call this concordance, and a standard cholesterol panel serves you perfectly well.
The interesting and clinically important situations are the mismatches, known as discordance. This is when your LDL cholesterol looks acceptable but your apoB is high, signalling many small particles quietly carrying on their work. In this scenario, a reassuring cholesterol result can give false comfort. A large 2024 review of 15 studies involving nearly 600,000 people found that apoB was a more accurate marker of risk than LDL cholesterol in every discordance study examined.
Who is most likely to be discordant
You are more likely to have a meaningful gap between your LDL cholesterol and your apoB if you have any of the following: high triglycerides, type 2 diabetes, metabolic syndrome, central weight gain around the abdomen, or a pattern of small dense LDL particles. People in these groups can have a deceptively normal LDL cholesterol while their particle count, and their risk, runs higher. This is precisely the group in which apoB adds the most.
What the Evidence Actually Shows
The case for apoB is strong, and it is worth being clear about what the research does and does not say.
On the supportive side, apoB has performed consistently well as a predictor of heart attack and stroke, often edging out both LDL cholesterol and non-HDL cholesterol, particularly in people whose results are discordant. Because it counts particles directly, it is less affected by the variations in particle size that can distort a standard cholesterol reading. For people with diabetes or high triglycerides, this advantage is most pronounced.
On the cautious side, this does not mean LDL cholesterol is worthless. Far from it. Lowering LDL cholesterol remains the single most trial-tested intervention in all of preventive cardiology. Decades of randomised trials, including the trials that established statins and newer agents such as PCSK9 inhibitors, were built on LDL cholesterol as the target, and the benefit of lowering it is beyond dispute. The online voices declaring LDL cholesterol irrelevant overstate the case considerably.
Why LDL, Triglycerides, and Lp(a) Still Matter
The enthusiasm for apoB has, in some corners of the internet, tipped into dismissing the numbers we have relied on for years. That is a mistake. Each of the established measurements tells you something apoB alone does not, and a good lipid assessment uses them together.
LDL cholesterol
LDL cholesterol is not a flawed or outdated number. It is the most thoroughly validated treatment target in cardiology, and every major guideline still places it at the centre of care. The reason is simple: when we lower LDL cholesterol in clinical trials, heart attacks and strokes fall in proportion, reliably and repeatedly. ApoB refines how we interpret LDL cholesterol in certain people. It does not unseat it. If you are tracking one number over time to see whether your treatment is working, LDL cholesterol remains an entirely sensible choice.
Triglycerides
Triglycerides are a separate and valuable piece of the puzzle. A raised triglyceride level is one of the clearest signals that your LDL cholesterol and apoB may be discordant, because high triglycerides tend to accompany the small, dense, numerous particles that apoB picks up. Triglycerides also respond strongly to lifestyle, which makes them a useful and motivating number to watch. Diet matters here, and the evidence supporting the Mediterranean diet and omega-3 fats is particularly relevant for people with elevated triglycerides.
Lipoprotein(a)
Lipoprotein(a), or Lp(a), deserves its own place on the test request entirely. It is largely inherited, it changes very little over a lifetime, and a single measurement tells you whether you carry this extra, independent layer of risk. While apoB does count Lp(a) particles among its total, it cannot tell you how much of your risk comes specifically from Lp(a), which is why a dedicated Lp(a) test remains worthwhile in its own right. For many people this is a once-in-a-lifetime measurement that meaningfully changes how aggressively their other risk factors should be managed.
What Does a Statin Do to Your ApoB?
This is a question worth answering directly, because it is one of the most useful things to understand about apoB in practice. Statins lower apoB substantially, typically by somewhere in the range of a quarter to nearly half, broadly in step with how much they lower LDL cholesterol. Adding ezetimibe or a PCSK9 inhibitor brings it down further still. So if you are already on treatment, your apoB is very likely already falling alongside your other numbers.
There is one important exception, and it is the reason apoB does not make the individual tests redundant. Statins do very little to lipoprotein(a). Someone can take a statin, watch their LDL cholesterol and apoB fall nicely, and still carry a high inherited Lp(a) that the treatment has barely touched. This is exactly why measuring Lp(a) at least once, separately, remains worthwhile even for people whose apoB looks well controlled.
ApoB Is One Piece of a Multifactorial Picture
Perhaps the most important point in this whole discussion is the one the online debate tends to forget. Cardiovascular disease is multifactorial. No single number, however good, captures your risk on its own, and apoB is no exception.
Your overall risk is shaped by a web of factors that interact with one another. These include your blood pressure, whether you have type 2 diabetes or features of metabolic syndrome, whether you smoke, your weight and waist measurement, your family history, your level of inflammation, and your age. A person with a perfect apoB but uncontrolled blood pressure and a smoking habit is not low risk. Conversely, a moderately raised apoB carries very different weight in an otherwise healthy 45-year-old than in someone with diabetes and a strong family history.
This is why fixating on any one marker, apoB included, can be misleading. The most useful approach is the one your cardiologist actually uses: weighing your lipids alongside every other modifiable factor. Two of the most powerful of those, smoking and high blood pressure, are entirely separate from your cholesterol particles and yet enormously important. You can read a fuller account in our overview of cardiovascular risk factors.
The Role of Investigations
Blood markers tell you about risk. Imaging can tell you what is actually happening in your arteries, and the two together are far more informative than either alone.
The coronary calcium score is the investigation patients most often ask about, and it can be confusing, so it is worth being clear. A calcium score does not measure your cholesterol or your particle count. It measures calcified plaque that has already formed in your coronary arteries, giving a direct picture of the disease itself rather than the risk factors driving it. A high score can prompt more intensive treatment even when your blood results look reasonable. Our article on what a high calcium score really means explains how to interpret the number.
One genuine source of confusion deserves a mention. Because statins can convert soft plaque into denser, calcified plaque, people on a statin can sometimes see their calcium score rise even as their risk falls. This apparent paradox is explained in our piece on statins and your calcium score. For people who need a more detailed look at the arteries themselves, a CT coronary angiogram can show both calcified and soft plaque. Inflammation markers such as hs-CRP can add yet another dimension. Which of these, if any, is right for you depends entirely on your circumstances and is a decision for you and your cardiologist.
Where the Guidelines Stand
The official guidance reflects this balanced reality. Different expert bodies place apoB at slightly different points on the spectrum, but none has discarded LDL cholesterol.
Guideline body
Position on apoB
European (ESC/EAS)
Accepts apoB as an alternative to LDL cholesterol for risk assessment. The 2025 update still confirms LDL cholesterol as the primary target.
Canadian (CCS)
The most apoB-forward. Allows apoB to be used as the primary therapeutic target, especially when triglycerides are raised.
United States (ACC/AHA)
Lists a high apoB as a risk-enhancing factor that supports more intensive treatment, but does not yet set a routine apoB target.
National Lipid Association
Proposes graded apoB targets that become stricter as cardiovascular risk rises.
The main reason apoB has not yet replaced LDL cholesterol everywhere is not weak evidence. It is the absence of a single agreed target across all guidelines, combined with a degree of caution about changing long-established practice. Availability and cost also vary from one health system to another.
Should You Add ApoB to Your Next Blood Test?
In Australia, apoB can be measured by most pathology laboratories, usually reported in grams per litre. It is not always part of a standard lipid panel and may not be routinely rebated, so it is worth asking whether it applies to your situation and whether there is an out of pocket cost.
There is a strong argument for measuring apoB at least once if you fall into a higher-risk group, particularly if you have raised triglycerides, type 2 diabetes, metabolic syndrome, or a family history of early heart disease. It is also useful when your LDL cholesterol seems well controlled but you or your cardiologist remain concerned about residual risk. For someone already tracking LDL, HDL, and lipoprotein(a), as many thoughtful patients now do, apoB is a natural and informative addition rather than a replacement for any of them.
What apoB cannot do is stand alone. It works best alongside your other blood results, any imaging you have had, and the broader picture of your risk factors. The number is only as useful as the conversation it prompts with the person managing your care.
Heart Matters Resource
When in Doubt, Get Checked Out
If you are unsure whether your cholesterol results tell the full story, a focused review of your numbers with your GP or cardiologist is one of the most worthwhile conversations you can have.
ApoB is one of the most useful advances in everyday cardiovascular risk assessment, because it counts the particles that actually cause plaque rather than estimating the cholesterol they carry. For people whose standard cholesterol result may be quietly misleading, it can uncover risk that would otherwise go unnoticed.
The balanced takeaway is this. LDL cholesterol, triglycerides, and lipoprotein(a) each remain valuable, and apoB sharpens the picture rather than replacing any of them. None of these numbers stands alone, because heart disease is multifactorial: your blood pressure, diabetes, smoking status, weight, and family history all matter alongside your lipids. The most useful conversation you can have is not about a single number, but about the whole picture, with the cardiologist who knows your circumstances.
Troponin is the blood test at the heart of chest pain assessment. If you have been to emergency with chest pain, here is what it measures and what the result means.
A right bundle branch block, often shortened to RBBB, is an electrical finding on an ECG. It means the signal travelling to the right side of the heart takes a slightly slower route than usual. It is not a blocked artery.
On its own, in a person who feels well and has a healthy heart, RBBB is common and usually harmless. It is found in roughly 1 in 100 adults, and the figure rises with age.
What matters is the context. A longstanding RBBB in someone with no symptoms is very different from a brand new RBBB that appears alongside chest pain or breathlessness.
RBBB becomes more important when it is new, when it occurs with symptoms, or when it appears together with other electrical changes on the same ECG.
Most people with isolated RBBB need no treatment at all. The block itself is not something that gets fixed, and in the majority of cases it never causes a problem.
Of all the phrases that can appear on an ECG report, “right bundle branch block” is one that sends people straight to a search engine, usually with a rising sense of alarm. The word block sounds ominous. It brings to mind a blocked artery, or something serious going wrong with the heart’s plumbing.
In the great majority of cases, it is neither of those things. This article explains what a right bundle branch block actually is, why it shows up, when it is nothing to worry about, and the smaller number of situations where it genuinely matters.
What the Bundle Branches Actually Do
Your heart has its own electrical wiring. Each beat begins with a signal that spreads across the upper chambers, then passes through a junction box in the centre of the heart and down into the two large lower chambers, the ventricles, which do the heavy pumping work.
From that junction box, the signal travels down two main cables, one to the left ventricle and one to the right. These cables are the bundle branches. They split into ever-finer fibres so that the electrical signal reaches every part of the muscle at almost the same instant, allowing both ventricles to squeeze together in a single coordinated beat.
A right bundle branch block means the cable to the right ventricle is not carrying the signal normally. The impulse is delayed or has to take a detour, reaching the right ventricle a fraction of a second later than it should. The heart still beats. The right ventricle still contracts. It simply gets its instruction by a slightly slower path.
This is quite different from a coronary artery problem, where the issue is blood supply rather than electrical signalling. If you would like to see the wiring for yourself, our interactive guide to your heart’s conduction system shows how the signal travels from the heart’s natural pacemaker down through the bundle branches to the ventricles.
What RBBB Looks Like on an ECG, in Plain Language
An ECG is a recording of the electrical signals that pass through your heart with every beat. Each beat produces a series of waves on the trace, and each wave reflects a different stage of that beat. The first small wave, called the P wave, reflects the upper chambers being activated. The tall central spike, called the QRS, reflects the contraction of the ventricles. The rounded wave that follows, the T wave, reflects those chambers electrically resetting before the next beat.
Because RBBB delays the signal to one ventricle, the two chambers no longer squeeze in perfect unison. The QRS spike, which is normally narrow and sharp, becomes wider and often develops a second bump, giving it a distinctive shape that a cardiologist recognises instantly.
Normal beat
The QRS spike is narrow and sharp. Both ventricles are activated almost together.
Right bundle branch block
The QRS is wider and carries a second bump. This is the delayed right ventricle catching up.
How to read this: the spike in the middle, the QRS, is the part to watch. A normal one is narrow and sharp. In RBBB it is wider and usually has a notch, like an M shape, because the right side of the heart is activated a beat behind the left. The small waves either side are not the focus here.
Why Does a Right Bundle Branch Block Happen?
There are many reasons, and they sit on a wide spectrum from completely benign to clinically important.
A normal variant
In many healthy people, RBBB is simply how their wiring is built. It can be present for life, cause no symptoms, and never lead to any trouble.
Age and the wiring itself
The conduction fibres can slow gradually with age, in the same way other tissues change over time. This is why RBBB becomes more common in later decades.
Strain on the right heart
Conditions that make the right side of the heart work harder, such as some lung conditions, can be associated with RBBB. Here the block is a signpost, not the problem itself.
Heart muscle conditions
Some conditions affecting the heart muscle or its valves can disturb the conduction system and produce RBBB along the way.
After a heart procedure
RBBB can appear after certain cardiac procedures or surgery. When expected, it is usually monitored rather than treated, and most people do well.
A sign during a heart attack
A brand new RBBB that appears during chest pain can be an important warning sign. This is the context that needs urgent assessment, not a routine finding.
The Question That Really Matters: Is It New?
This is the single most useful thing to understand about a right bundle branch block. The pattern itself tells a cardiologist relatively little until it is placed in context, and the most important piece of that context is whether the block is new or longstanding.
A right bundle branch block that has been present on previous ECGs for years, in someone who feels well, is reassuring. It is part of that person’s normal electrical signature. Research consistently shows that isolated RBBB in people without other heart disease carries an excellent outlook.
A right bundle branch block that has appeared for the first time, particularly alongside symptoms such as chest pain, breathlessness, or fainting, is a different matter. Here the new block may be a clue that something is happening in the heart right now, and it deserves prompt evaluation. This is why your cardiologist will often be very interested in finding an old ECG to compare against.
RBBB and LBBB Are Not the Same Story
It is natural to assume that a block on the right and a block on the left are mirror images of each other, equally significant. In practice, they tend to carry different weight.
A left bundle branch block more often prompts a closer look at the heart muscle and its pumping function, because the left ventricle is the heart’s main pump. An isolated right bundle branch block, by contrast, is more frequently a benign finding in an otherwise healthy person.
This is a generalisation rather than a rule, and the context still governs everything. But it helps explain why a patient might be told their RBBB is nothing to worry about while a friend with an LBBB was sent for more tests.
Will I Have Symptoms?
Most people with a right bundle branch block have no symptoms from it whatsoever. They feel completely normal, and the finding is picked up by chance on an ECG done for an unrelated reason, such as a routine check, a pre-operative assessment, or an insurance examination.
Because RBBB itself rarely causes symptoms, any symptoms that are present, such as breathlessness, palpitations, or fainting, usually point to whatever underlying condition is present rather than to the block on its own. That is part of why your cardiologist treats the symptoms and the whole clinical picture, not the line on the ECG report.
What Happens Next, and What Tests Might Be Done
If an isolated RBBB is found and you feel well, often the answer is simply that nothing further is needed beyond noting it on your record. Knowing it is there is valuable in itself, because it gives every future ECG a baseline to compare against.
When the context suggests a closer look is worthwhile, your cardiologist may arrange an echocardiogram, an ultrasound scan that shows the heart’s structure and how well it is pumping. This helps confirm whether the heart muscle and valves are normal. Depending on the situation, blood tests or a period of heart rhythm monitoring may also be suggested.
The point of these tests is not the block itself, which generally cannot and need not be reversed. It is to make sure there is nothing else going on that the RBBB might be pointing to.
When RBBB Sits Alongside Other Findings
One situation deserves a mention because it changes the picture. Sometimes RBBB appears on an ECG together with other conduction delays. When the heart’s electrical pathways show several areas of slowing at once, cardiologists pay closer attention, because the wiring is showing wear in more than one place.
In a small number of people, particularly those who also have symptoms such as fainting, this combination may eventually lead to a conversation about a pacemaker. This is the exception rather than the rule, and it applies to a minority of cases. The great majority of people with a simple, isolated RBBB never approach this territory.
Heart Matters Resource
When in Doubt, Get Checked Out
A new finding on an ECG, or one that comes with chest pain, breathlessness, or fainting, is always worth discussing promptly with your GP or cardiologist rather than worrying about alone.
A right bundle branch block is an electrical finding, not a blocked artery, and for most people who carry one it is a harmless quirk of their heart’s wiring that will never cause a problem. The word block makes it sound far more alarming than it usually is.
What turns a routine finding into one worth investigating is context: whether it is new, whether it comes with symptoms, and whether it sits alongside other changes. If your ECG shows a right bundle branch block and you feel well, the most likely explanation is the most reassuring one. If it is new or you have symptoms, it is worth discussing with your cardiologist promptly, who can place that single line on the report into the bigger picture of your heart.
The echocardiogram is cardiology’s most comprehensive non-invasive imaging test. Here is what it reveals about your heart and what to expect from the procedure.
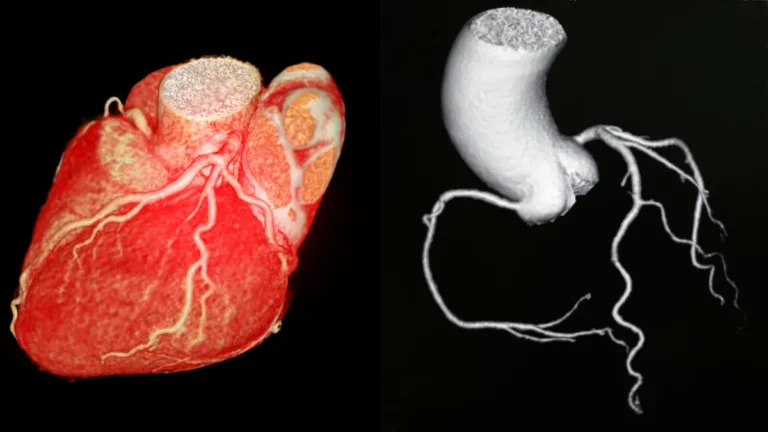
The CT coronary angiogram gives a detailed view of the coronary arteries without any catheters, just a scan and a cannula. Here is what to expect from the procedure and how to interpret the results.
Your Privacy
Heart Matters uses cookies to improve your experience and analyse how our site is used. You can accept all cookies or manage your preferences below.
Functional
Always active
The technical storage or access is strictly necessary for the legitimate purpose of enabling the use of a specific service explicitly requested by the subscriber or user, or for the sole purpose of carrying out the transmission of a communication over an electronic communications network.
Preferences
The technical storage or access is necessary for the legitimate purpose of storing preferences that are not requested by the subscriber or user.
Statistics
The technical storage or access that is used exclusively for statistical purposes.The technical storage or access that is used exclusively for anonymous statistical purposes. Without a subpoena, voluntary compliance on the part of your Internet Service Provider, or additional records from a third party, information stored or retrieved for this purpose alone cannot usually be used to identify you.
Marketing
The technical storage or access is required to create user profiles to send advertising, or to track the user on a website or across several websites for similar marketing purposes.
To provide the best experiences, we use technologies like cookies to store and/or access device information. Consenting to these technologies will allow us to process data such as browsing behavior or unique IDs on this site. Not consenting or withdrawing consent, may adversely affect certain features and functions.
Functional
Always active
The technical storage or access is strictly necessary for the legitimate purpose of enabling the use of a specific service explicitly requested by the subscriber or user, or for the sole purpose of carrying out the transmission of a communication over an electronic communications network.
Preferences
The technical storage or access is necessary for the legitimate purpose of storing preferences that are not requested by the subscriber or user.
Statistics
The technical storage or access that is used exclusively for statistical purposes.The technical storage or access that is used exclusively for anonymous statistical purposes. Without a subpoena, voluntary compliance on the part of your Internet Service Provider, or additional records from a third party, information stored or retrieved for this purpose alone cannot usually be used to identify you.
Marketing
The technical storage or access is required to create user profiles to send advertising, or to track the user on a website or across several websites for similar marketing purposes.